Hystrix-dashboard是一款针对Hystrix进行实时监控的工具,通过Hystrix Dashboard我们可以在直观地看到各Hystrix Command的请求响应时间, 请求成功率等数据。但是只使用Hystrix Dashboard的话, 你只能看到单个应用内的服务信息, 这明显不够. 我们需要一个工具能让我们汇总系统内多个服务的数据并显示到Hystrix Dashboard上, 这个工具就是Turbine.
Hystrix Dashboard
我们在熔断示例项目spring-cloud-consumer-hystrix的基础上更改,重新命名为:spring-cloud-consumer-hystrix-dashboard。
1、添加依赖
<dependency>
    <groupId>org.springframework.cloud</groupId>
    <artifactId>spring-cloud-starter-hystrix</artifactId>
</dependency>
<dependency>
    <groupId>org.springframework.cloud</groupId>
    <artifactId>spring-cloud-starter-hystrix-dashboard</artifactId>
</dependency>
<dependency>
    <groupId>org.springframework.boot</groupId>
    <artifactId>spring-boot-starter-actuator</artifactId>
</dependency>
这三个包必须添加
Hystrix Dashboard是Hystrix的仪表盘组件,主要用来实时监控Hystrix的各项指标信息,通过界面反馈的信息可以快速发现系统中存在的问题。
Dashboard使用时注意事项:
1, Dashboard服务是个独立的结点,不需要配置eureka信息,只需要依赖以下jar包
- <dependency>
- <groupId>org.springframework.cloud</groupId>
- <artifactId>spring-cloud-starter-hystrix</artifactId>
- </dependency>
- <dependency>
- <groupId>org.springframework.cloud</groupId>
- <artifactId>spring-cloud-starter-hystrix-dashboard</artifactId>
- </dependency>
- <dependency>
- <groupId>org.springframework.boot</groupId>
- <artifactId>spring-boot-starter-actuator</artifactId>
- </dependency>
2, Dashboard主程序也很简单,就是个标准的Spring boot应用,多了个@EnableHystrixDashboard注解
- @SpringBootApplication
- @EnableHystrixDashboard
- public class HystrixDashboardApplication {
- public static void main(String[] args) {
- SpringApplication.run(HystrixDashboardApplication.class, args);
- }
- }
3, 要确保被监控的服务打开了Actuator(依赖spring-boot-starter-actuator),开启了断路器(@EnableCircuitBreaker注解)。
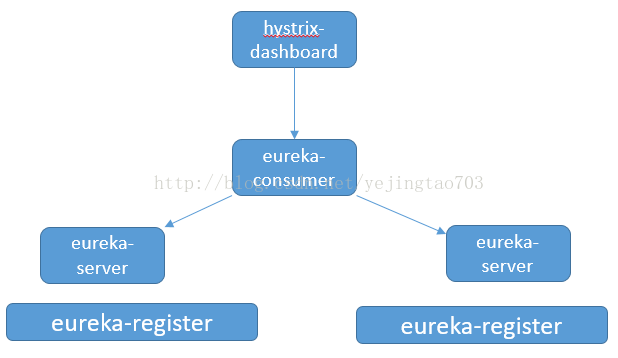
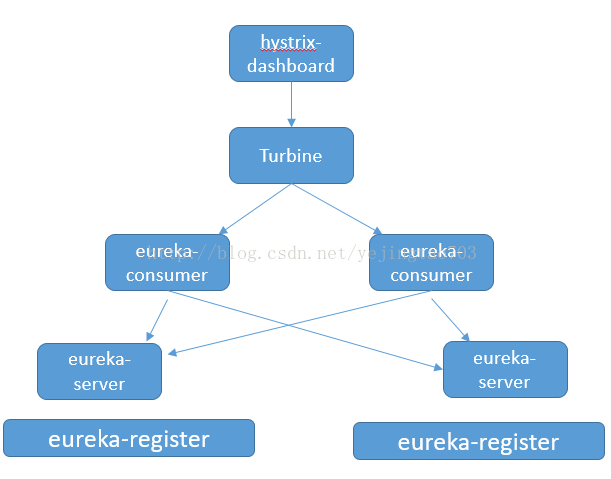
我们的部署结构如图:
Register代码:https://github.com/yejingtao/forblog/tree/master/demo-eureka-register
Server代码:https://github.com/yejingtao/forblog/tree/master/demo-eureka-server
Consumer代码:https://github.com/yejingtao/forblog/tree/master/demo-eureka-consumer
Dashboard代码:https://github.com/yejingtao/forblog/tree/master/demo-hystrix-dashboard
Dashboard是独立启动的不需要任何其他配置,其它部分的启动和详解请看上篇介绍(Spring Cloud Eureka+Ribbon+Hystrix),浏览器请求http://127.0.0.1:2001/hystrix,看到页面
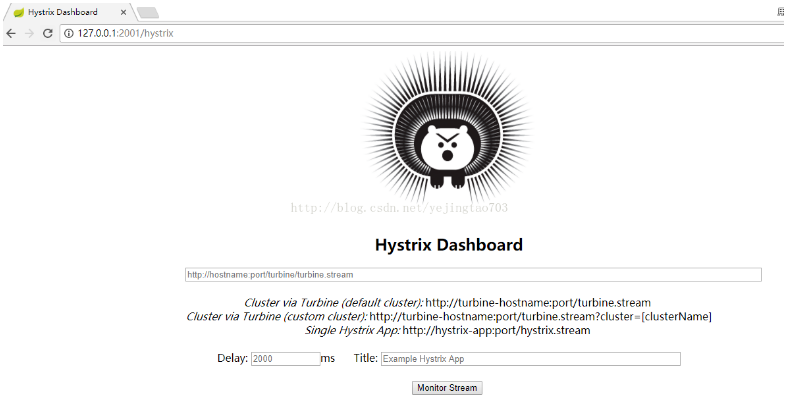
Cluster via Turbine (default cluster): http://turbine-hostname:port/turbine.stream
Cluster via Turbine (custom cluster): http://turbine-hostname:port/turbine.stream?cluster=[clusterName]
Single Hystrix App: http://hystrix-app:port/hystrix.stream
这三句话很重要,介绍了不同情况下不同的请求地址,前两者对于集群模式,第三种对应单结点模式,我们现在使用的Single模式,用第三种连接,页面的第一个长条地址栏输入consumer的服务地址:http://127.0.0.1:9000/hystrix.stream
看到如下内容
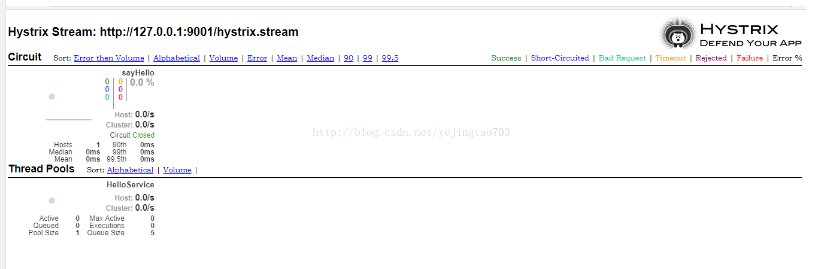
(注:开始用的Edge浏览器死活看不到这个页面,还以为自己程序搭建错误,后来换成chrome就好了,坑了我很久)
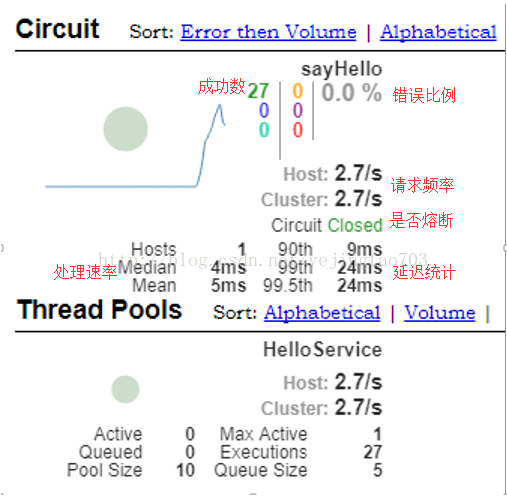
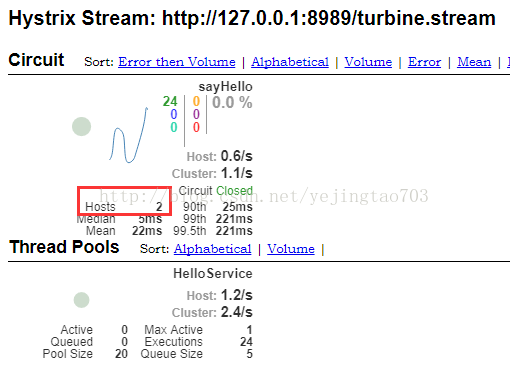
实心圆:颜色代表健康度,(绿-黄-红-橙递减);大小代表并发量。
曲线:请求量的变化
其他主要参数间图红色字体部分。
以上是单结点服务的统计,但是生产上为了服务的健壮性都是多结点,我们可以开多个浏览器输入不同的地址来监控每一个结点,虽然这样可行但是很傻,所以我们对部署结构稍作改造。
被监控的consumer变成了多个,在Dashboard之前需要一个收集器Turbine。
Turbine代码:https://github.com/yejingtao/forblog/tree/master/demo-turbine
Pom依赖
- <dependency>
- <groupId>org.springframework.cloud</groupId>
- <artifactId>spring-cloud-starter-turbine</artifactId>
- </dependency>
- <dependency>
- <groupId>org.springframework.boot</groupId>
- <artifactId>spring-boot-starter-actuator</artifactId>
- </dependency>
参数
- spring.application.name=turbine
- server.port=8989
- management.port=8900
- eureka.client.serviceUrl.defaultZone=http://peer1:1111/eureka/,http://peer2:1112/eureka/
- turbine.cluster-name-expression="default"
- turbine.combine-host-port=true
- turbine.app-config=CONSUMER
监控的url输入http://127.0.0.1:8989/turbine.stream
发现结果略有区别
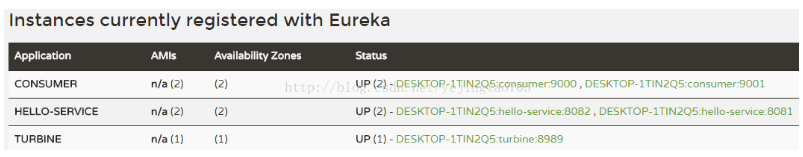
此时的eureka上的情况是:
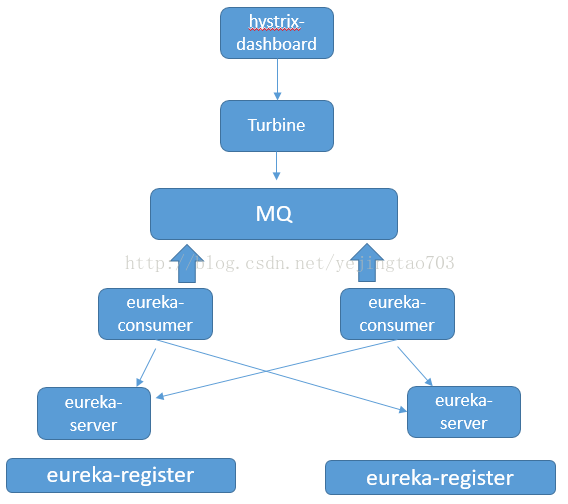
实时的监控是很消耗性能的,改架构还有改造的空间,将对健康度的采集交给MQ异步处理,架构如下
来源:https://blog.csdn.net/yejingtao703/article/details/77683102


